(Glorious) Goodwood Angles, Stats & Pointers…
Five days of Glorious Goodwood action to concentrate on next week…
Five days we can be deeply involved in high-class racing and forget about the rest of the world…just for a little while…
I’ve already begun my analysis for the meeting, providing full NTF Members with seven pages of angles, stats and pointers, aimed specifically at the roller-coaster twists and turns that is Goodwood racecourse.
If you want to hook on to the main service and grab the Goodwood analysis then there is a special £10 offer available here.
Below is a brief snapshot of the members stats guide, to aid your own Goodwood analysis for Glorious Goodwood 2020…
*stats are taken from 2014-present and cover ALL meetings run at Goodwood (not just Glorious Goodwood) – majority of stats taken from Proform Professional database
Goodwood Angles, Stats & Pointers…
.
The Trainers…
When it comes to training winners at Goodwood, two men stand clear at the top of the pecking order… MARK JOHNSTON and RICHARD HANNON…and they are the logical place to start with any trainer-based analysis for the track…
.
MARK JOHNSTON
60/379 | 16% S/R | +£120.66 BFLSP – W&P 142/379 | 37% S/R
26% above expectation | 55% PRB
Johnston is comfortably the winning most trainer at Goodwood (since 2014) but he’s fired out 379 runners to find those 60 winners (bettered only by Richard Hannon’s 467 runners) so the challenge for us punters is, as is always the case with Johnston, trying to decipher which of his raiders is the one that is going to peak on the day.
Unfortunately, there is no real easy answer or ‘angle in’ to solve that problem.
Joe Fanning rides most of the Johnston Goodwood horses (127 of the 379, striking at a 19% S/R for a +£78.95 BFLSP return) and that wouldn’t be a bad area to concentrate on, certainly better than following those ridden by Franny Norton for Johnston at Goodwood (6/71 | 8% S/R | -£37.26 BFLSP). Indeed, if you wanted to follow the Johnston/Fanning axis at Goodwood it’s possibly worth concentrating on the following…
Johnston/Fanning | Goodwood | Class 2 or below | SP 14/1 or less
22/80 | 28% S/R | +£116.14 BFLSP – W&P 36/80 | 45% S/R
97% above expectation | 62% PRB
Bar a minor -0.59 loss in 2018 that ‘mini’ angle would have returned some decent profits each year since 2014.
It also worth noting, however, that the likes of Silvestre De Sousa, James Doyle and William Buick also return positive figures when riding for Johnston at Goodwood…
So, in short, Johnston wins a serious amount of races at Goodwood, and will likely to continue to do so go forward, but there isn’t really, unfortunately, an ‘easy’ way in to his runners on the stats front. He WILL, however, have his string ready to fire for Glorious week…
The Richard Hannon rundown is available in the full stats guide, which you can get in the NTF Members Area…
Although the Johnston/Hannon powerhouses will have plenty winners on the Sussex downs, and their runners definitely should not be ignored, from a pure angles perspective here are a couple from the full guide that I like to concentrate on…
.
Goodwood Trainer Angles (2014 – present)
.
WILLIAM HAGGAS
W Haggas | Listed level or below | 7f+ | SP 9/1 or less
24/73 | 33% S/R | +£47.68 BFLSP – W&P 43/73 | 59% S/R
52% above expectation
**
CHARLIE APPLEBY
C Appleby | Non-Handicaps | 0-4 career starts | 0 Career wins | Top 4 in market
14/25 | 56% S/R | +£43.37 BFLSP – W&P 16/25 | 64% S/R
80% above expectation
The Jockeys…
Goodwood is undoubtedly one of the trickiest tracks for a jockey to navigate. Some jockeys make it look easy whilst others…well…don’t! That’s not a slight on their abilities, but as with any walk of life some people excel in one area of their profession and others come to life elsewhere, that’s just life.
At Goodwood I like to look at the jockey angle from two perspectives…the straight track (5f & 6f races) and the turning tracks (7f and longer races).
Jockeyship really comes to the fore in those turning track races (7f+) with each extra furlong in distance providing its own unique set of bends and undulations to navigate.
Take a look at the course map and see for yourself…

With that rollercoaster to try and navigate it’s no surprise that it pays to know which jockeys to trust to get the job done on a regular basis, especially when it comes to the Handicaps run round the Goodwood bends.
The handicaps are generally well-supported and draw large fields, which at a track like Goodwood will naturally bring interference at vital junctures, plenty of argy-bargy as the field jostle for position and more than the fair share of ‘hard luck’ stories.
Knowing when to press on the gas pedal to get a good early and mid-race position and, equally, knowing when to ease off and let others waste petrol on the tougher parts of the track are vital tactics that jockeys need to have in their armoury (as well as all the other parts of the tactical jigsaw needed to successfully navigate the uber-competitive Goodwood bend handicaps) and the following group of jockeys master this art ‘better’ than others…
*Stats look at all Goodwood handicap races run over 7f and further (bend handicaps)
JOE FANNING – 19/90 | 21% S/R | +£84.40
ANDREA ATZENI – 13/73 | 18% S/R | +£45.55
ADAM KIRBY – 11/58 | 19% S/R | +£22.82
*Full list of jockeys available in NTF Members Guide
Let’s look at that group a bit closer…
JOE FANNING
Fanning I already covered in the Mark Johnston stats and his 90 rides and 19 winners in the bend handicaps are almost exclusively down to his partnership with Mark Johnston (72 rides and 16 winners – his 3 other winners came for Alan King, Amanda Perrett & Michael Stoute). If you want to knuckle down to some kind of Fanning Goodwood angle, then you’d be looking at…
Fanning | Goodwood 7f+ Handicaps | FR/CP runners | June or later | SP 14/1 or less
16/48 | 33% S/R | +£114.43 BFLSP – W&P 25/48 | 52% S/R – 133% above exp
The monthly filter is almost certainly linked to the yards he rides with rather than anything to do with the jockey himself.
ANDREA ATZENI
Nothing ‘outstanding’ to report about Atzeni in these races but it is perhaps interesting that he’s able to successfully ride winners from the front, close to pace AND out the back in these contests, indeed he’s one of the best round here from ‘out the back’. The other interesting aspect of his winners in these contests is the fact that they all had between 2 & 4 starts in the last 3 months, returning figures of…
13/48 | 27% S/R | +£70.55 BFLSP – W&P 21/48 | 44% S/R – 111% above exp
That angle is more to do with the yards he rides for than his abilities at the track, however, but it’s an interesting angle to keep in mind, nevertheless.
ADAM KIRBY
Kirby’s ‘weak’ point seems to come when he’s drawn in the inside stalls (stalls 3 or less) where his stats read…1/21 | 5% S/R | -£15.32 BFLSP – W&P 2/21 | 10% S/R – 66% below exp…give him a starting point out a bit wider (stall 4 or higher), however, and things improve plenty…
10/37 | 27% S/R | +£38.14 BFLSP – W&P 21/37 | 57% S/R – 114% above exp | 66% PRB
When he’s drawn in stall 4+ in the 7f+ Goodwood handicaps and he’s on a Favourite he returns even better figures…
9/12 | 75% S/R | +£41.26 BFLSP – W&P 10/12 | 83% S/R
.
The Draw…
Always worth a quick look at the draw stats at such an idiosyncratic track as Goodwood. Generally I’d bunch the distances together at plenty of tracks but if you flick back to the course map included earlier in the guide it’s clear we need to consider each distance on it’s own merits, given different bends and loops are in play depending on which distance you are looking at.
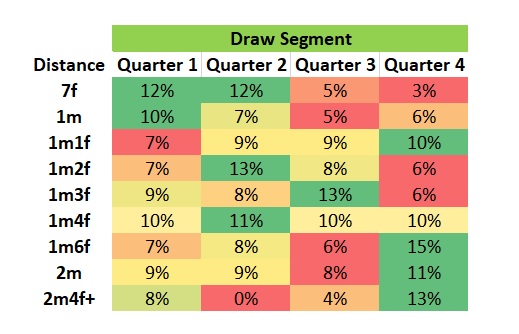
For this piece of analysis I’ve gone back to 2012 (to present day) to give a bit more beef to the numbers and I’m looking at handicaps of 8 or more runners over 7f+ trips. Then I’m breaking down the stalls into quarters. For example in a 12-runner field stalls 1-3 would be quarter 1, stalls 4-6 would be quarter 2, stalls 7-9 would be quarter 3 and stalls 10-12 would be quarter 4.
This is how the draw map works out…

The 7f figures are the most interesting, with the bottom half of the draw (Q1 & Q2) looking very strong and holding a healthy advantage over the top half of the draw, especially the top Quarter (Q4).
The bottom half remain strong at the 1m trip as well, although not quite as strong as over 7f.
Things begin to even out as you move up the distances, with the 1m4f stats telling you there is no real advantage to any part of the draw.
Things then switch round when you reach the staying trips (1m6f+) which is almost certainly due to the fact that runners start by running back down the track (the opposite direction) before looping back and running the ‘proper’ direction.
The 7f figures are definitely the most interesting though, even more so when you consider races with 14 or more runners, with the bottom half of the draw striking at 10% and the top half at a paltry 2%, 84% of 7f handicaps with 14 or more runners have been won by horses draw in the bottom half of the draw (Q1 & Q2).
That should give you something to work with for next week 😎
If you want the full guide (from which the above was cherry-picked from) and access to all of next weeks NTF Glorious Goodwood analysis, then you can hook up to the main service on the following…
>>Join NTF for Glorious Goodwood
Cheers and best of luck – Ben (NTF)


Brilliant breakdown, particularly the stalls/quarters/distance section. Always good reading and information. Many thanks for your efforts ( a labour of love? )
Thanks Drew, glad you enjoyed the post 😎
I’d say what I do is a labour of love/the day job! The lines blurred a very long time ago…
Cheers – Ben (NTF)
What else will you be covering next week?
Hi Adrian
Five days of Glorious Goodwood will be more than enough to cover.
I may do stats for a couple of big races at Galway but the main focus will be Goodwood.
Cheers – Ben (NTF)
Sorry, I meant as a newbie, what will the content be?
Is it trends on every race? All trainer trends etc?
Its not clear from above what you get for your money and when you get it.
Hope that makes sense?
Ah, OK, got you now…
It will be Trends on selected races, I’m looking at around 17-races that will get my race trends coverage. May be slightly less than that come final decs but 17 potentially fit the criteria for my race trends coverage.
I’ll also highlight any Trainer Trends qualifiers throughout the week.
I always provide my analysis the evening before the next days racing…so Tuesday analysis available on Monday night, Wednesday analysis available on Tuesday night…and so on…
If you click on one of the sign-up links above it takes you to a page that outlines what to expect in the members area during Glorious Goodwood week.
Cheers – Ben (NTF)
Very interested in the pace / draw combo for Goodwood at various trips
Will you be covering that?
Possibly. There’s a chance it will come up naturally in the analysis anyway, although it’s not that easy to get all the relevant data on one database (as in you can get different bits from different databases).
But there is a potential it will appear in my analysis when relevant, yes.
Cheers – Ben (NTF)
sussex stakes kamenko falls into these stats but you have not included
Hi Dave
Sorry, stat was meant to read…
15/15 recorded a top 3 LTO finish over 7f – 1m2f between 21 & 49 days previous
Obviously Kameko was 4th in the Derby LTO so fails that stat.
Cheers – Ben (NTF)